Power indicator Gauge
Openhasp device
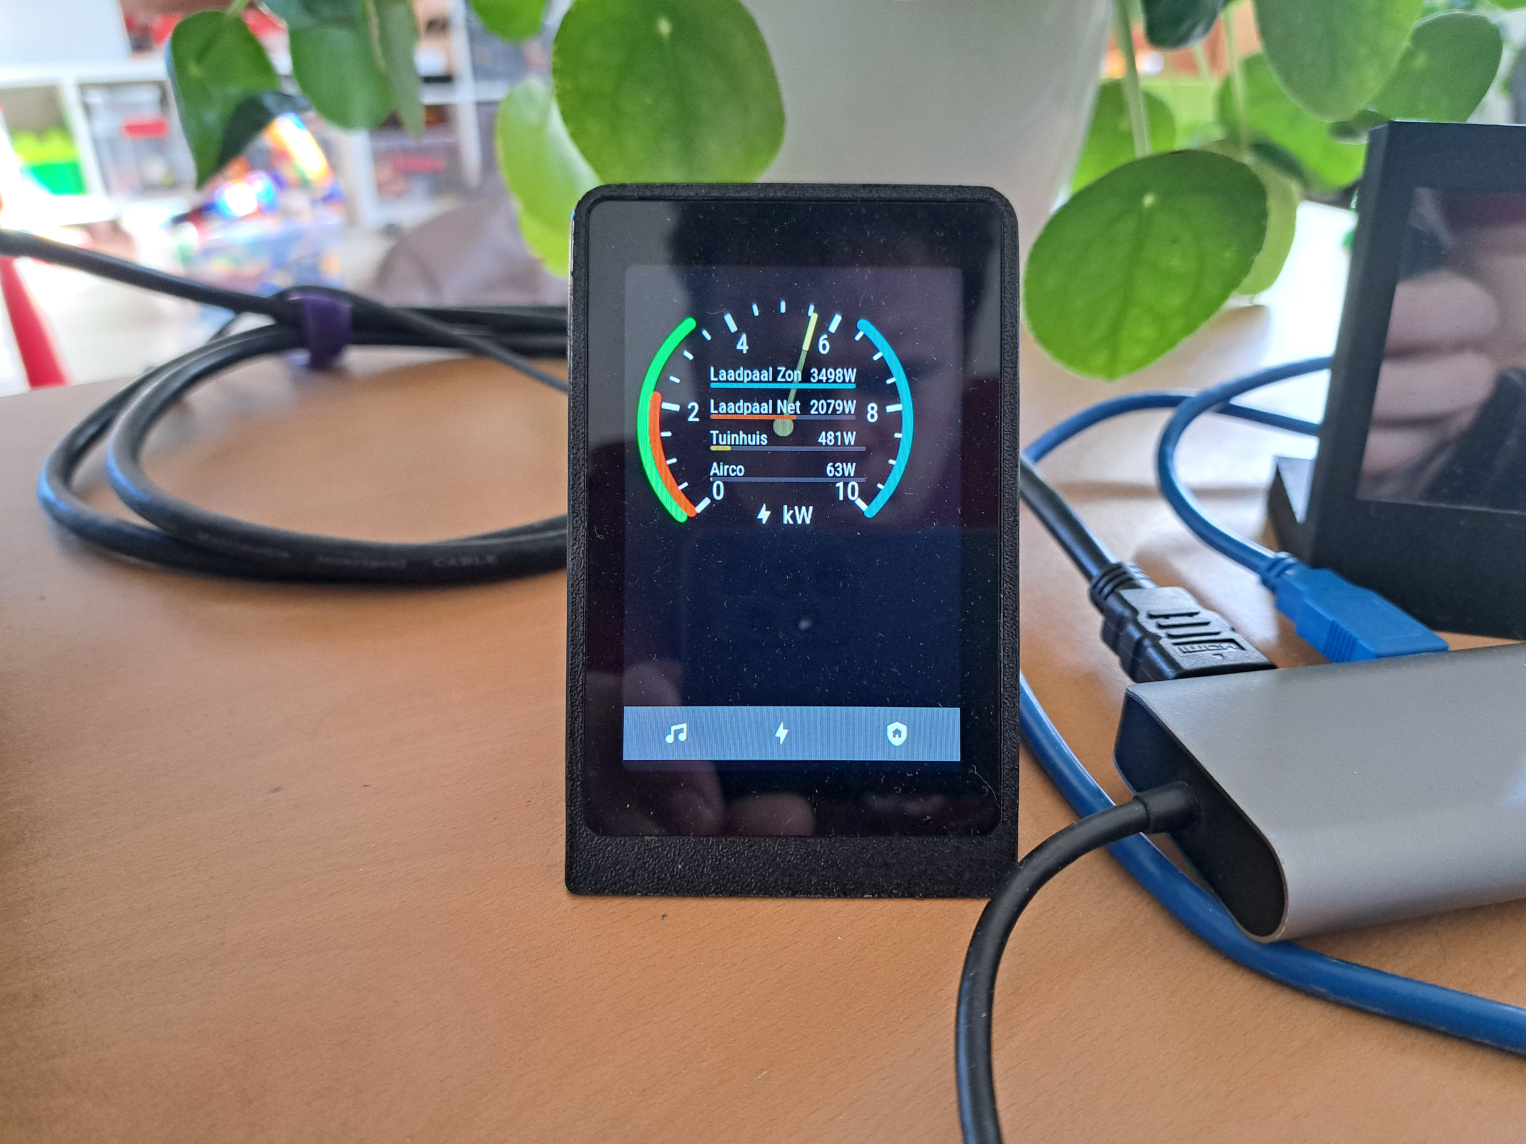
My openHASP control panels have been eye catchers on my desk for years now. I've been using the WT32-SC01 Plus one for over a year to keep an eye on the electric power use in our house.
I designed a fancy power dial with extra arc indicators on the outside and a dynamic list of the biggest power consumers in the middle..
The idea
I had this idea of using a classic needle gauge to show the momentary power level, and add a few colored arcs to the sides to visualize these things:
- Momentary total power consumed by all devices
- In green, the solar production arcs up from the left side, if this arc matches the needle, or goes above it, all is good.
- In red, the power used from the grid, ideally no red line appears at all!
- In magenta, the power injected to the grid arcs from the right side back to the left. If its length is equal to the green arc, we're injecting all solar production.
- In turquoise, the solar power used for charging the car is shown arcing from the right. If there's more solar than the car can handle, a piece of magenta might pop over it at the bottom.
Concept diagram
Here are some early screenshots of the prototypes:
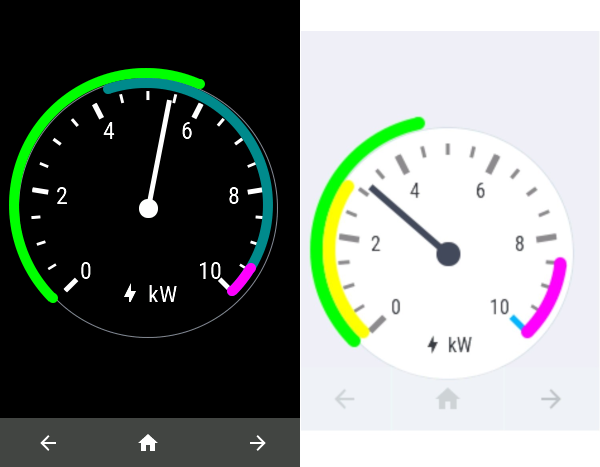
Screenshots
I added a top 4 of the biggest consumers along with progress bars representing their relative demand (including colors, car solar use is blue!). I got this idea from Sean Blanchfield's blog post on Real Time Device Power Meter for Home Assistant. I have the same view on my Home assistant dashboard using the widget mentioned on that post, and it's so nice it shouldn't be missing from my openHASP page!
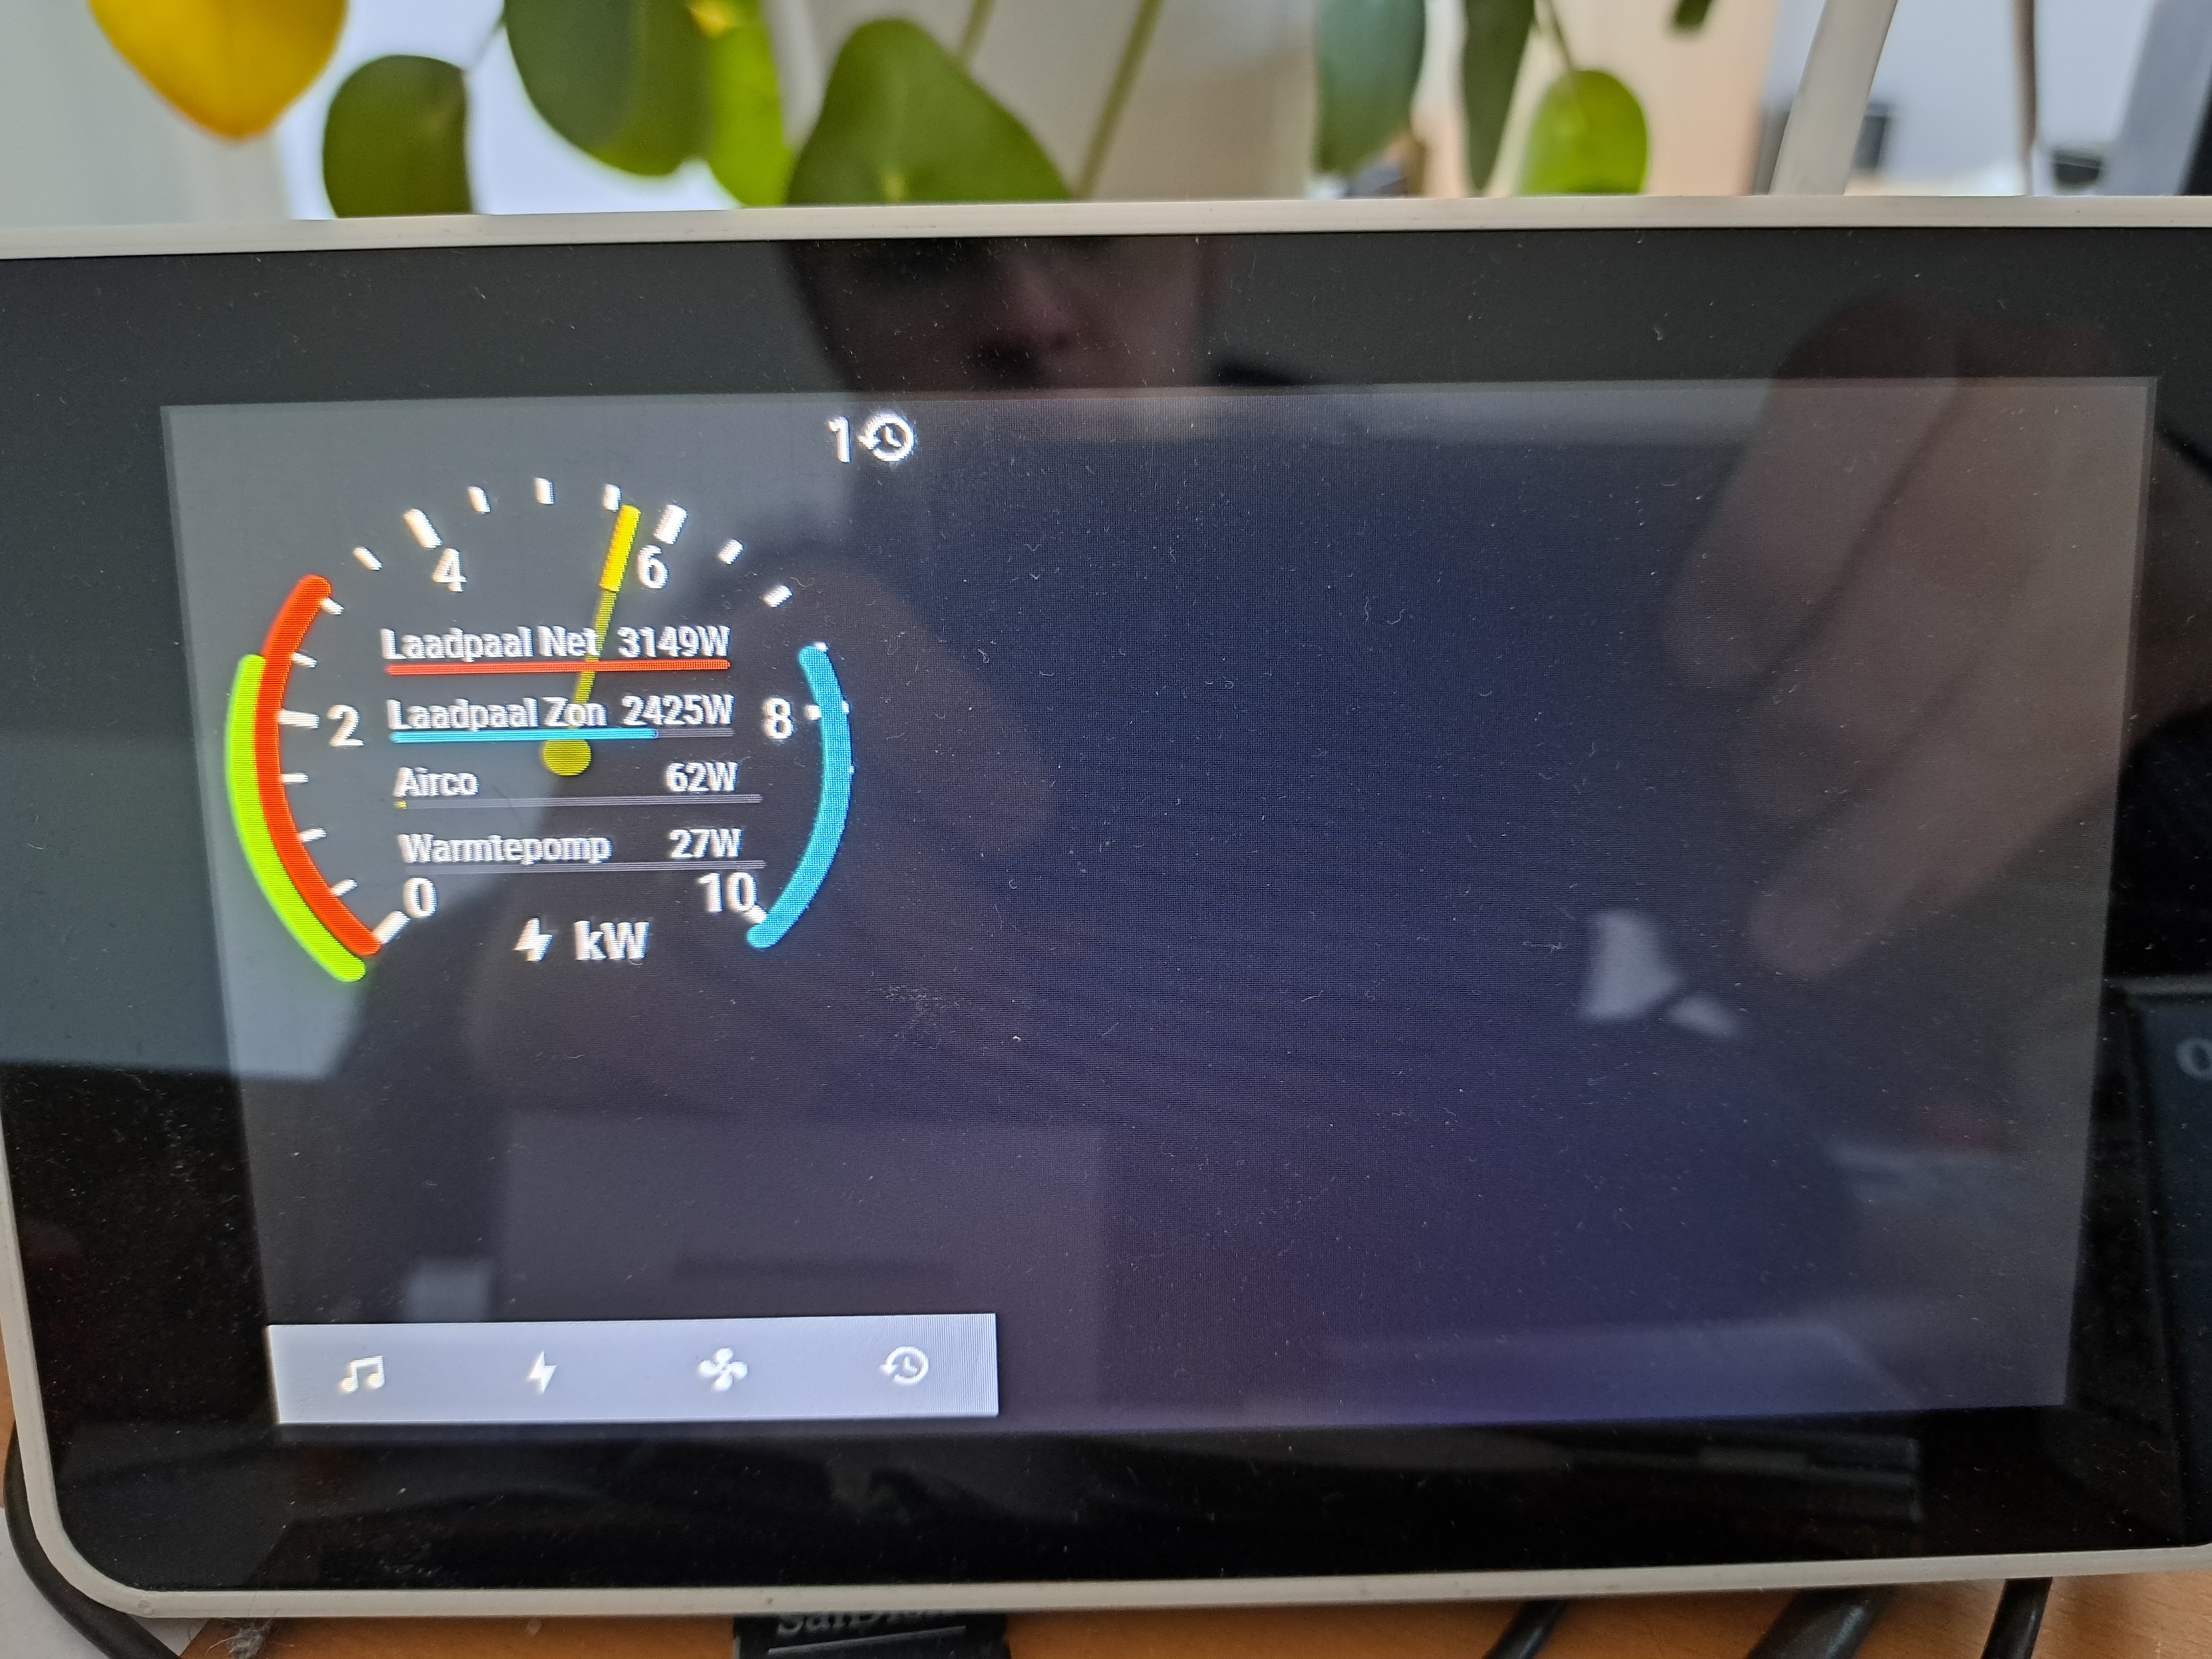
Raspberrypi running openHASP showing the consumers.
Hardware
I had WT32-SC01 board, it's a nice display with a capacitive touchscreen layer, way better than the resistive ones on my previous builds. I wanted to use the same shaped enclosure as my my other openhasp builds and found this WT32-SC01-Plus Stand With Socket enclosure on printables.com.
Appdaemon automation
This appdaemon script monitors the homeassistant entities, and will publish messages to the MQTT server to update the openHASP widget state to reflect the new values.
sensors = {
    "sensor.sdm120_2_power": "Airco",
    "sensor.warmtepomp_int_power":"WP Weerstand",
    "sensor.sdm120_1_power":"Warmtepomp",
    "sensor.tuinhuis_power": "Tuinhuis",
    "sensor.car_solar_power_2":"Laadpaal Zon",
    "sensor.car_grid_power_2": "Laadpaal Net",
    "sensor.nikoplug_power": "Ventilatie",
    "sensor.badkamer_chauffage_power": "Badkamer",
    "sensor.kitchen_1_power": "Keuken-ww",
    "sensor.kitchen_2_power": "Keuken l",
    "sensor.droogkast_power": "Droogkast",
    "sensor.wasmachine_power": "Wasmachine",
    "sensor.veranda_power": "Veranda",
    "sensor.fornuis_power": "Kookvuur",
    "sensor.oven_power": "Oven",
}
colors = (
    (0, 2, '#a1a2a1'),
    (2, 10, '#3ea832'),
    (10, 50, '#85a832'),
    (50, 200, '#a8a432'),
    (200, 500, '#a88732'),
    (500, 1000, '#a86732'),
    (1000, 3000, '#a84632'),
    (3000, 10000, '#a83232'),
)


class Energy(hass.Hass):

    def update(self, entity, attribute, old, new, cb_args):
        self.log(f"got update for  {entity}: {new}")
        new = int(float(new))
        self.db[entity] = new
        highest = max((float(v) for v in self.db.values()))

        to_show = list(reversed(sorted(self.db.items(), key=lambda x:x[1])))
        to_show = list(to_show)[0:4]
        for i, (e, v) in enumerate(to_show):
            self.publish_entry(i, sensors[e], float(v)*100/highest, v)
    def re_evaluate(self):
        self.publish_entry(0, "test", 40, 20)

    def darken(self, color):
        r = color[1:3]
        g = color[3:5]
        b = color[5:7]
        r = int(r,16)
        g = int(g,16)
        b = int(b,16)
        reduce = 50
        r -= reduce
        g -= reduce
        b -= reduce
        new = f"#{r:02x}{g:02x}{b:02x}"
        return new
    def watt_to_color(self, watt):
        for start, end, color in colors:
            if watt > end:
                continue
            if watt < end:
                return color
        return colors[0][2]
    def publish_entry(self, index, name, percent, value):
        self.call_service("mqtt/publish", topic=f"hasp/plate_desk/command/p2b{42+3*index+0}.val", payload=f"{percent}")
        if name == "Laadpaal Zon":
            color = "#008b8b"
        else:
            color = self.darken(self.watt_to_color(value))
        self.call_service("mqtt/publish", topic=f"hasp/plate_desk/command/p2b{42+3*index+0}.bg_color10", payload=color)
        self.call_service("mqtt/publish", topic=f"hasp/plate_desk/command/p2b{42+3*index+1}.text", payload=name)
        self.call_service("mqtt/publish", topic=f"hasp/plate_desk/command/p2b{42+3*index+2}.text", payload=f"{value}W")

    def initialize(self):
        self.db = {}
        for entity_name in sensors.keys():
            try:
                self.db[entity_name] = int(float(self.get_state(entity_name)))
            except Exception as e:
                self.log(f"can't retrieve entity {entity_name} on start")
            self.listen_state(self.update, entity_name)
OpenHASP design
This is the list of OpenHASP widgets that make up the plate's 'page' that displays the power gauge, it consists of JSON lines, one line per widget:
{"page":2,"comment":"---------- Page 2 ----------", "bg_color":"#000000", "swipe":1}
{"id":13,"obj":"gauge","x":20,"y":20,"w":260,"h":260, "min":0,"max":10000, "val":2000, "critical_value": 10000, "scale_end_color": "#FF0000", "format": 3, "bg_color":"000000", "scale_grad_color":"#ffffff", "scale_end_color":"#ffffff", "line_color10":"#ffff44","line_width10":5,"line_opa":255, "line_color":"#ffffff","line_color60":"#ffffff","scale_grad_color":"#ffffff","scale_grad_color60":"#ffffff","scale_end_color60":"#ffffff", "bg_color10":"#ffff44", "border_color20":"#000000"}
{"page":2,"id":17,"obj":"arc","x":6,"y":10,"w":270,"h":290,"min":0,"max":10000,"val":2000,"border_side":0,"type":0,"rotation":0,"start_angle":135,"end_angle":45,"adjustable":"false","line_width":21,"line_width10":10,"line_color10":"#00ff00","line_color20":"#ffffff","line_opa30":"0","bg_opa":0,"pad_top20":5,"pad_bottom20":5,"pad_left20":5,"pad_right20":5,"pad_bottom":5,"pad_left":5,"pad_right":5}
{"page":2,"id":20,"obj":"arc","x":16,"y":10,"w":270,"h":270,"min":0,"max":10000,"val":3000,"border_side":0,"type":0,"rotation":0,"start_angle":135,"end_angle":45,"adjustable":"false","line_width":21,"line_width10":10,"line_color10":"#ffff00","line_color20":"#ffffff","line_opa30":"0","bg_opa":0,"pad_top20":5,"pad_bottom20":5,"pad_left20":5,"pad_right20":5,"pad_bottom":5,"pad_left":5,"pad_right":5}
{"page":2,"id":18,"obj":"arc","x":16,"y":10,"w":270,"h":270,"min":0,"max":10000,"val":500,"border_side":0,"type":0,"rotation":0,"start_angle":135,"end_angle":45,"adjustable":"false","line_width":21,"line_width10":10,"line_color10":"#ff0000","line_color20":"#ffffff","line_opa30":"0","bg_opa":0,"pad_top20":5,"pad_bottom20":5,"pad_left20":5,"pad_right20":5,"pad_bottom":5,"pad_left":5,"pad_right":5}
{"page":2,"id":25,"obj":"arc","x":16,"y":10,"w":270,"h":270,"min":0,"max":10000,"val":0,"border_side":0,"type":2,"rotation":0,"start_angle":135,"end_angle":45,"adjustable":"false","line_width":21,"line_width10":10,"line_color10":"#008b8b","line_color20":"#ffffff","line_opa30":"0","bg_opa":0,"pad_top20":5,"pad_bottom20":5,"pad_left20":5,"pad_right20":5,"pad_bottom":5,"pad_left":5,"pad_right":5}
{"page":2,"id":19,"obj":"arc","x":16,"y":10,"w":270,"h":270,"min":0,"max":10000,"val":0,"border_side":0,"type":2,"rotation":0,"start_angle":135,"end_angle":45,"adjustable":"false","line_width":21,"line_width10":10,"line_color10":"#ff00ff","line_color20":"#ffffff","line_opa30":"0","bg_opa":0,"pad_top20":5,"pad_bottom20":5,"pad_left20":5,"pad_right20":5,"pad_bottom":5,"pad_left":5,"pad_right":5}
{"obj":"label","id":16,"x":0,"y":220,"w":300,"h":24,"text":"\uF40B kW","align":"center","text_color":"#ffffff","value_font":22,"bg_color":"#000000","bg_opa": "0","radius":0,"border_side":0}
{"page":2,"id":60,"obj":"obj","x":75,"y":75,"w":150,"h":150,"radius":1000,"border_color":"#000000","bg_opa10":188,"bg_color10":"#000000"}

{"obj":"bar","id":42,"x":80,"y":110,"w":140,"h":4,   "border_width":0,"val":70,"bg_color10":"#a83232", "bg_color":"#111111","radius10":5,"radius00":5}
{"obj":"label","id":43,"x":80,"y":89,"w":139,"h":20,"bg_color":"#000000","border_color":"#C7BAA7","border_width":0,"text":"Warmtepomp hitte","text_font":16,"align":"left"}
{"obj":"label","id":44,"x":80,"y":90,"w":140,"h":20,"bg_color":"#000000","border_color":"#C7BAA7","border_width":0,"text":"10W","text_font":16,"align":"right"}

{"obj":"bar","id":45,"x":80,"y":140,"w":140,"h":4,   "border_width":0,"val":50,"bg_color10":"#3ea832", "bg_color":"#111111","radius10":5,"radius00":5}
{"obj":"label","id":46,"x":80,"y":120,"w":139,"h":20,"bg_color":"#111111","border_color":"#C7BAA7","border_width":0,"text":"Thuinhuis","text_font":16,"align":"left"}
{"obj":"label","id":47,"x":80,"y":120,"w":140,"h":20,"bg_color":"#000000","border_color":"#C7BAA7","border_width":0,"text":"20W","text_font":16,"align":"right"}

{"obj":"bar","id":48,"x":80,"y":170,"w":150,"h":4,   "border_width":0,"val":20,"bg_color10":"#a8a432", "bg_color":"#111111","radius10":5,"radius00":5}
{"obj":"label","id":49,"x":80,"y":150,"w":139,"h":20,"bg_color":"#111111","border_color":"#C7BAA7","border_width":0,"text":"Keuken","text_font":16,"align":"left"}
{"obj":"label","id":50,"x":80,"y":150,"w":140,"h":20,"bg_color":"#000000","border_color":"#C7BAA7","border_width":0,"text":"30W","text_font":16,"align":"right"}

{"obj":"bar","id":51,"x":80,"y":200,"w":150,"h":4,   "border_width":0,"val":20,"bg_color10":"#a8a432", "bg_color":"#111111","radius10":5,"radius00":5}
{"obj":"label","id":52,"x":80,"y":180,"w":139,"h":20,"bg_color":"#111111","border_color":"#C7BAA7","border_width":0,"text":"Keuken","text_font":16,"align":"left"}
{"obj":"label","id":53,"x":80,"y":180,"w":140,"h":20,"bg_color":"#000000","border_color":"#C7BAA7","border_width":0,"text":"30W","text_font":16,"align":"right"}

{"page":2,"id":61,"obj":"obj","x":0,"y":0,"w":320,"h":420,"border_opa":0, "border_color":"#000000","bg_opa10":0,"bg_color10":"#ffffff", "swipe":1}

{"page":0,"comment":"---------- All pages ----------","swipe":1}
{"page":0,"obj":"btn","id":1,"x":0,  "y":420,"w":80,"h":50,"opacity":255,"text":"\uE75A","radius":0,"border_width":"0","bg_color":"#444444","text_font":24,"action":"p1","text_color":"#ffffff"}
{"page":0,"obj":"btn","id":2,"x":80,"y":420,"w":80,"h":50,"opacity":255,"text":"\uF40B","radius":0,"border_width":"0","bg_color":"#44444","text_font":24,"text_color":"#ffffff", "action":"p2"}
{"page":0,"obj":"btn","id":3,"x":160,"y":420,"w":80,"h":50,"opacity":255,"text":"\uE210","radius":0,"border_width":"0","bg_color":"#444444","text_font":24,"text_color":"#ffffff","action":"p3"}
{"page":0,"obj":"btn","id":5,"x":240,"y":420,"w":80,"h":50,"opacity":255,"text":"\uE2DA","radius":0,"border_width":"0","bg_color":"#444444","text_font":24,"text_color":"#ffffff","action":"p4"}

{"page":0, "obj":"label","id":4,"x":0,"y":0,"w":300,"h":30,"text":"?\uE2DA","value_font":22,"bg_color":"#000000", "text_color":"#ffffff", "bg_opa": 0,"radius":0,"border_side":0, "align":"right"}
Home assistant dashboard equivalent
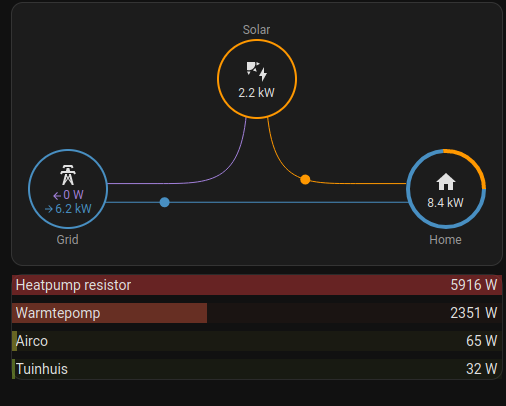
Home assistant power visualisation using bar-card and custom template card.
Check out my article on the modbus current clamps to see how I measure the power on several of the breaker circuits of my house and how to add a similar bar card visualisation.
Chores
I also added a page to the openHASP displaying the periodical house chores tracked in Grocy. This deserves its own article actually!
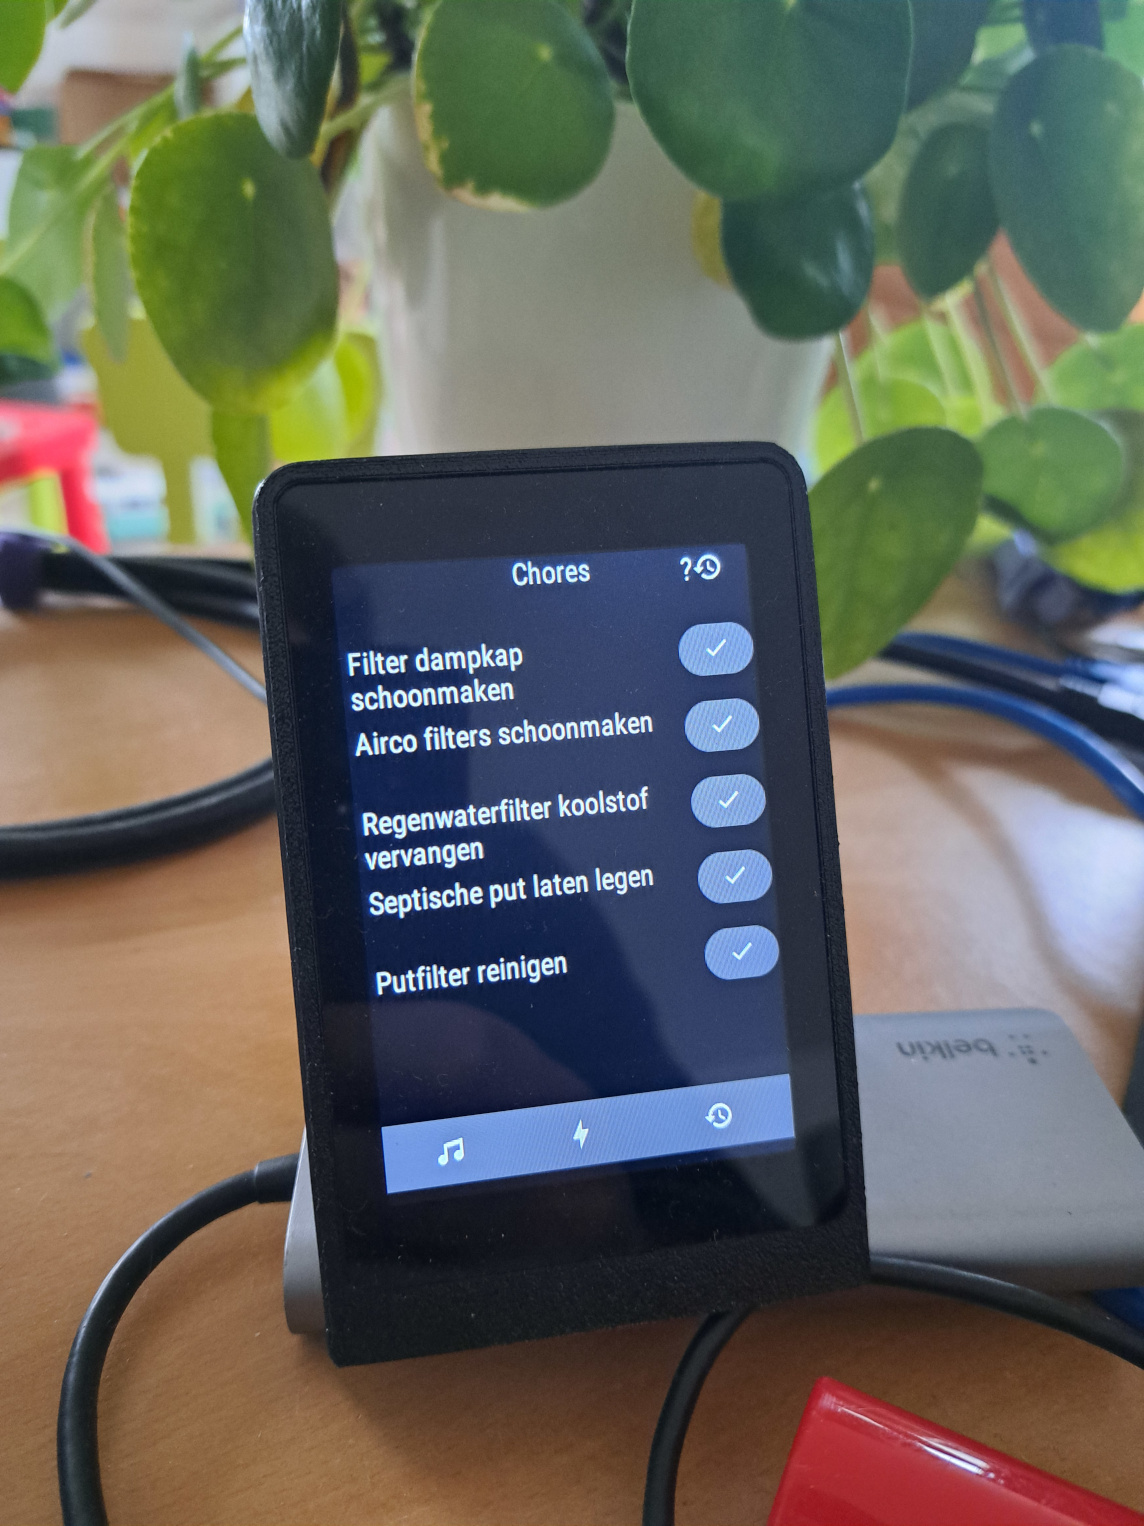
chores
Liked something? Worked on something similar? Let me know what you think on Mastodon!
You can use your Mastodon account to reply to this post.